We have a different Result interface for our PRO users. The new interface is a part of AidStream’s paid version – AidStream PRO. The PRO result interface follows a whole different workflow as compared to the previous interface.
This article will support you to report your result data with the PRO result interface.
Steps to add a new result:
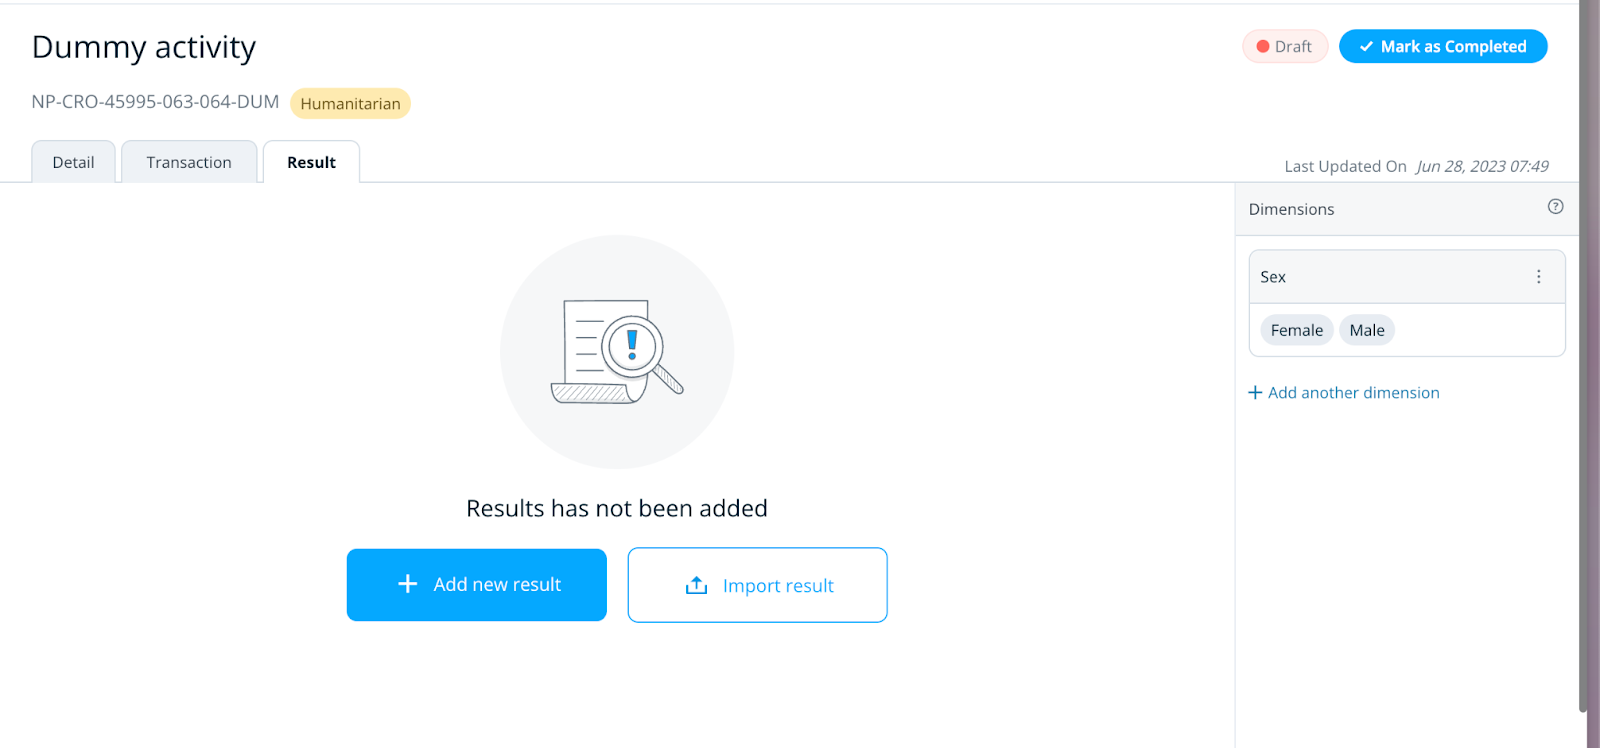
- Click on the result page of the relevant activity.

- You will get directed to the result tab.

Notice the ‘Dimensions’ section at the right-hand side of the page. Dimensions can be added before you start adding your result data. Since dimensions are (usually) global within an activity, the dimension library allows you to create a set of dimensions for later use.
To add a dimension:
- Click on the ‘Add a dimension’ button.

- A pop-up box will appear for you to fill in.

- After you fill in the required fields, click ‘Save’.
- The dimensions will appear as seen in the picture below. The dimensions library will be visible throughout the Result tab.
Note: Dimensions can also be added afterwards after the result and indicators have been created.
Adding result data
- Click on ‘Add new result’ to add a new result.
- After clicking on ‘Add new result’, a pop-up box will appear where you can fill in the result data.

- After filling in the relevant fields, save the data. After the result is created, you can add an indicator for the result using the ‘Add new indicator’ button adjacent to the result title.

- A pop-up box with the indicator’s fields will appear.

- Fill in your relevant information and save the data.
- After the data is saved, it will appear in the table right below the relevant result’s title.

- Now, go to ‘Add new baseline’ to add your baseline data. Fill in the relevant information.
Notes:
- The dimensions created and saved earlier will appear in the ‘Dimension’ section as seen in the picture below.
- Locations recorded in the Location element of the activity is automatically pulled to the Location sub-element here.
- If you want to include Location data in your result, please ensure that the location is defined beforehand in the Location element. Refer to this article for clarity.

8. After the desired data has been filled in, save your data to move on to the next step.

The data in the PRO result interface is grouped on the basis of their dimension and location.
To add period data to an existing baseline:
- Click on the ‘Add period’ button in the same row as the baseline data.
- The dimension and location data will be prefilled for you (and cannot be edited).

- Fill in the period start and end date, and the target/actual value and save the data.
- To add a comment or document to your target or actual value, hover on the value on the table. You will see the options ‘Add a comment’ or ‘Add a document link’, click on the relevant option to add your data.

- Once the data has been added and saved, it can be viewed by hovering on the relevant value.

Comments
0 comments
Please sign in to leave a comment.